Configuration of the logger is the
procedure to change the properties of the logger and start a new session of
logging. If you are already in the Logger
Status page, clicking on the Configure button will bring up the Logger
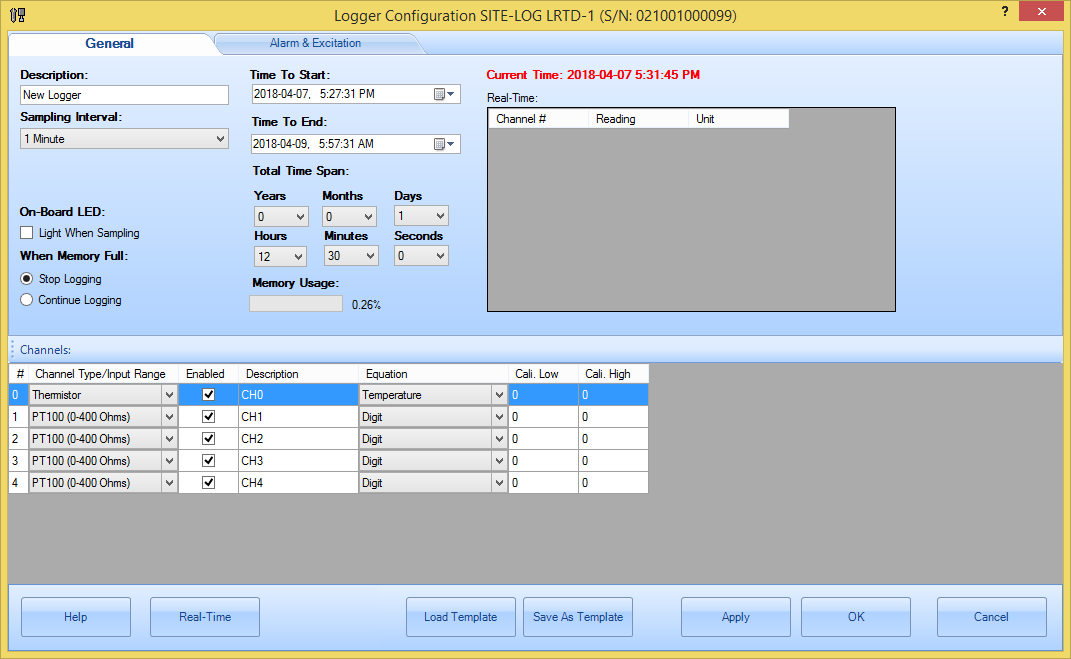
Configuration dialog: The new session can be started immediately after the logger
is configured or start in the future by adjusting the Time to Start
field. If you want the logger to stop logging after a specific
period of time: If you want the logger to continue logging for a specific
period of time: If the start time is unknown and you want to activate the new
session in the field: When the logger is operating, the
logger samples the source channels in a preset time
interval (sampling interval). Most of Site-Log loggers can run as fast as
sampling one channel every 20 milliseconds, or as slow
as sampling all channels every 12 hours. If the sampling interval is
set 5 seconds or bigger, the logger will operate in normal sampling mode.
In this mode, if the logger is logging data, the logger will continue operating
while it is communicating with the host device. If the sampling
interval is set below 5 seconds the logger will operate in fast sampling
mode. In this mode, the logger needs
the external power supply for the logging period and the communications with the
logger will force the logger to stop logging. The above example is for SITE-LOG
series. For iLog series, you can decide either below 5
seconds or 1 second the logger will run in fast mode. For PRECISE-LOG series,
there is no fast mode and the fastest interval is 1 second. When the logger is operating, the
logger measures the input of each ENABLED channel. Be sure to enable the
channel if you want the channel be recorded. If one channel’s measurement
relies on other channels’ measurements (A custom equation may use other
channels’ measurements for the current channel’s calculation), be sure to enable
those dependent channels. Some of the Site-Log loggers are
featured with software programmable channels. The input range of those channels
can be changed via SiteView. When the range is changed
to better fit the actual input signal’s range, better resolution and accuracy
can be obtained. For instance, changing the Input Range of a programmable voltage
channel to 0 – 2 V will get better resolution if you know the input source’s
range will be within 0 – 2 V. When the logger saves the data the
logger saves the data in digital format. SiteView
converts the digital values to the physical measurements after the data is
downloaded to the computer. double
output; } Starting from SiteView 3, a new factory Liner equation was introduced
and you can fill out four parameters to quickly create a linear equation.
Refer to this video tutorial for the instructions: Although you can go through the procedure in Calibrate
Logger chapter to calibrate a logger, you can also use Logger
Configuration dialog to do a quick calibration for all channels of the
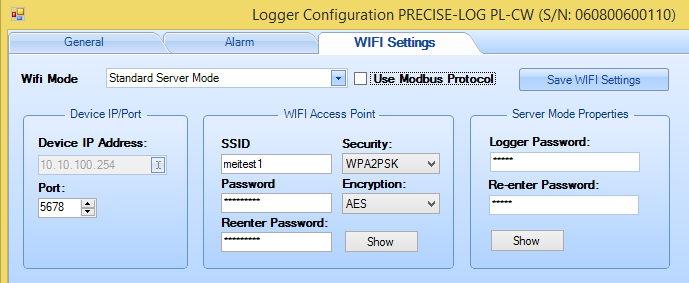
logger. If PRECISE-LOG contains a WIFI
module, the following are used to configure the module. There are two WIFI mode: 1
Standard Server Mode: 2
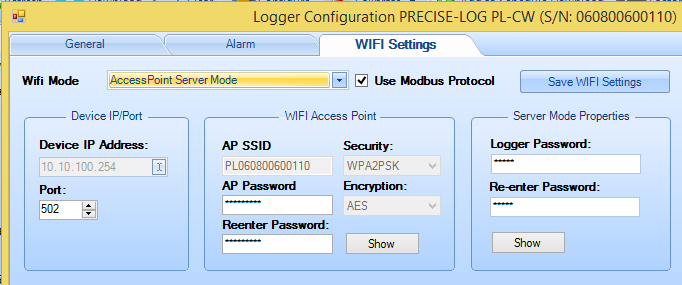
AccessPoint Server
Mode: In this mode, the data logger
will create a WIFI Access Point for a host PC to join. AP SSID is the AP the data logger
created. The AP name is based the data logger's serial number and it is formated
as "PL" + "logger's serial number". You can change AP password to
join this access point. After you joined you can communicate with the data
logger through USB Server connection. The IP address of the data logger is fixed
to: 10.10.100.254. Once you have finished making changes to the available
settings, you can click OK button to save the settings to the logger. The
logger will start to record data from the Time to Start field you have set. WARNING: By clicking OK or Apply buttons, all
recorded data in the logger will be lost. If the data is important please ALWAYS
download the data before configuring the logger.

Decide when to
start and when to stop logging
If you want the logger to stop at a specific time:
Decide how
often logger samples source
Decide which
channels to log on
Decide how to
convert to physical measurement
SiteView does the data conversions by using equations. An
equation is a software entity handling the conversion from one data format to
another. SiteView contains the built-in equations
for those predefined channel types and the customer-defined equations that can
be applied to all channel types.
A custome-defined equation (custom equation) is a piece of
script (C# source code) in the format of function implementing the data
conversion.
When a channel is configured, an equation is applied to
the channel. After SiteView has retrieved the logger
status SiteView locates the equation entity by the
equation name saved inside the logger. Once the equation entity is identified
the equation entity will handle the data conversion.
This depends on the physical measurement and the input
source parameters. If you are using 0 – 10 VDC channel to record a voltage
source, you can use a built-in equation “VoltageDC”.
If you are recording a 0 – 10 VDC transducer as the source input, and the
transducer has the measurement range of 0 – 5000 PPM CO2, you need to write
your custom equation like this:
public
double
CO2Equation(double
Input)
{
output = 5000 * Input
/ 10 ;
return
output;
The above equation implements the relationship between
the input voltage value and the output physical PPM value. A voltage
is converted proportionally to a PPM value. Manage Alarm and Excitation
Control (for SITE-LOG series)
When the
logger is recording data, it compares the current reading with Low/High Alarm
values that is previously saved in the logger for each channel. If all the
following conditions are met, the logger will be in Alarm state:
1. The current reading is beyond the Low/High Alarm
values.
2. Alarm is enabled for that channel.
3. Alarm-On Delay’s
counter is counted down to zero.
In the figure illustrated
below, you can check “Alarm Enabled” check-box if you want to enable the Alarm
of the channel. And you can adjust “Low Alarm” and “High Alarm” values so that
when the measurement is below “Low Alarm” or above “High Alarm” it will
trigger the alarm.
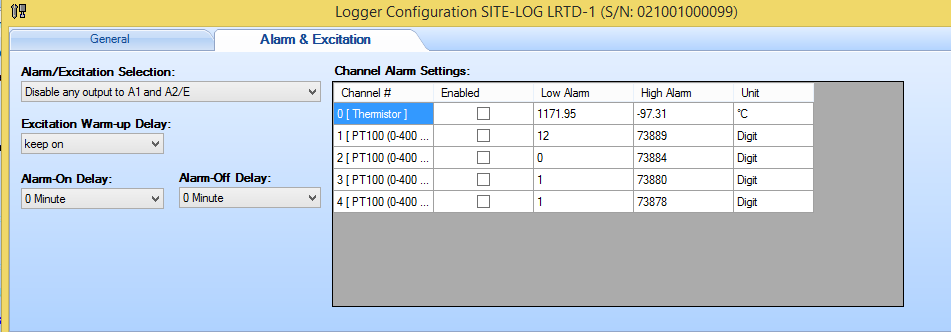
If the logger is alarm
state, the logger can energize Alarm1 and/or A2/E terminals in order to
control the external devices like siren auto dialer etc.
At the left side of the above figure, you can change Alarm/Excitation Selection to decide
which terminals the logger will work with when there is an alarm.
Excitation
output is used when you need to save the electric power of the device that
provides the signal source to the data logger. When there is no local power
available and a battery pack is used to power the transducer, excitation
control greatly reduces power consumption by turning on the transducer only
when it samples the data and turning off the transducer after the sampling.
A2/E on the terminal strips can be configured by for excitation
purpose.
In order to enable A2/E,
one of the following Alarm/Excitation Selection must be selected:
Excitation control to A2/E, both high and low
alarm to Alarm1
Excitation control to A2/E, low alarm to
Alarm1
Excitation control to A2/E, high alarm to
Alarm1
Excitation Warm-up Delay is used to specify how much
delay will be set after the excitation terminal is activated and before the
logger is taking the sample. If the measurement source device needs certain
time to stabilize the signal output you may need to set this parameter so the
logger will wait certain time before it takes the sample. Quick way to calibrate logger
These two fields specify the
calibration values that are used for measurement
adjustment.
Cali. Low value specifies the
digital value that is over zero when the input value is the lowest value (for
0 – 5 VDC channel the lowest value is zero volt). For instance, if you apply
zero volt input and the logger measured 100 as the digital value, then
Cali. High value specifies
the digital value that is over 65535 when the input value is the highest value
(for 0 – 5VDC channel the high range is 5 volt). For instance, if you apply 5
volt voltage to the channel and the logger measured 65100 as the digital
value. Then
The valid range for
these two parameters is from –32768 to 32767.
The
following figure illustrates the relationship between an ideal data line and a
measured data line and how

Cali.
Low and
To calibrate a
channel:
1.
Click
Real-Time button to enable Real-Time table. Notice the real-time
readings are updated in Reading cells for all
channels.
2.
Check the
difference between the reading you see and the reading it is supposed to be.
Adjust
3.
If you are
satisfied, click Apply button to save the parameters to the logger or
click OK button to save the parameters and close the dialog.
Save WIFI Related
Settings (for PRECISE-LOG with WIFI series)
In this mode, both the data logger and a host
PC will join an existing WIFI network (Access Point).
Save Settings and Start New
Session